
Why Critical Chain Project Management (CCPM)?
Critical Chain is a powerful Theory of Constraints (TOC) methodology for solving project management problems and streamlining timelines to deliver projects better, faster and for lower cost.
While most manufacturers focus on improving operations or supply chain functions to drive better results, improving project management for new product launch and development processes is an often overlooked way to boost your bottom line.
The emergence of Critical Chain Project Management
The truth is that most projects run late, over budget and skate outside of scope. Yet the science of project management scarcely changed in decades — that is, until the emergence of Critical Chain theory, first espoused by Eli Goldratt in his 1997 book Critical Chain.
Critical Chain Project Management (CCPM) is the TOC solution for planning, scheduling, and managing performance in a project environment.
The “critical chain” is the constraint of a project: the longest sequence of dependent events through a project network considering both task and resource dependencies in completing the project.
A CCPM approach provides all-important visibility and the ability to effectively synchronize your operation’s technical resources. This can streamline and accelerate product launch and development timelines to dramatically increase revenue and business profitability.
Explore CCPM at Critical Chain 2024
Critical chain theory is a fundamental principle of Montera’s Flow Management System for
improving manufacturing performance.
SPEAKERS
Montera CEO Jack Warchalowski and Executive VP Duncan Patrick will share their expertise on CCPM applications at the Critical Chain 2024 conference April 17-18.
LEVERAGING CCPM FOR NEW PRODUCT LAUNCH SUCCESS
Their presentation How CCPM Helps Manufacturers Successfully Launch New Products and Increase Business Profitability explains how applying CCPM to new product development and product launch processes fits with the overall improvement strategy of a manufacturing business.
Implementing CCPM principles at the outset of a project can dramatically cut lead time, which increases the capacity of a manufacturing organization.

“If your team takes six months instead of a year to design and build a prototype, you have actually doubled your capacity, which pays especially big dividends in high-volume manufacturing.”
— Jack Warchalowski, Montera CEO
STALMAX CASE STUDY
The presentation describes how Stalmax, a high-volume manufacturer of fasteners for the auto industry, is successfully leveraging CCPM and Roadrunner Px project management software for their Advanced Product Quality Planning (APQP) and other development processes to increase the profitability of their entire operation.
LIVE Q&A
A live Q&A session with Jack and Duncan will follow the online presentation.
Critical Chain Project Management at scale
CCPM methodology is the core of Montera’s Roadrunner Px project management software.
It applies Critical Chain to all your project management activities in real time, prioritizing tasks and resources, resolving conflicting priorities, and reducing ineffective multitasking.
Roadrunner Px ensures task gains offset task delays and facilitate full kitting while improving quality and minimizing rework. You can view the priority of active projects to determine which project needs the most attention using the ratio of Critical Chain complete to Project Buffer consumed.
This helps our manufacturing clients deliver projects 25% to 40% faster while increasing throughput by 25% to 50%.
Learn more about our Roadrunner ERP Expansion Pack software for project management, inventory management, production management and business intelligence.
Follow Montera on LinkedIn
For conference updates, and more operations and supply chain best practices and insights, follow Montera on LinkedIn.
Are you a fan of The Goal?
Put theory into practice with our Goal Workshop for your team.

Is inventory imbalance killing your KPIs?
Too much and not enough inventory at the same time destroys your plant and business performance. Here’s how to stop the Stock Shock effect.
Do you evaluate inventory levels by “months” or “days” of remaining stock? In this article, we’ll discuss why that approach is insufficient, how it causes inventory imbalances that hurt your bottom line, and how a Demand-Driven Replenishment approach can transform your results.
Inventory imbalance: a KPI wrecking ball
First, let’s start with a definition: an inventory imbalance is when you have too much or too little of a SKU compared to the target for the stocking item.
Inventory imbalances are all too common due to forecasting difficulties (see more below), and the tug-of-war between operations and finance, which are often in disagreement about inventory levels.
Finance wants to keep inventory down to conserve cash. Operations typically aims for higher levels to accommodate consumption and supply factors.
(The reality is that finance is not opposed to inventory – but they want to see the business improve return on investment and cash flow KPIs.)
The stock shock effect on KPIs
These converging factors typically result in both overstock and understock SKUs that create a stock shock effect that reverberates throughout the plant and negatively impacts these key performance indicators (KPIs):
- Cash flow dries up.
- Throughput drops.
- Sales slow down.
- Expediting and overtime increase.
- Your bottom line suffers.
Inventory imbalance is like a wrecking ball on these key KPIs that drive plant and business performance.
But what about your MRP?
Now for the elephant in the room: Shouldn’t your MRP be able to solve this problem?
The truth is no MRP can do it alone. Here’s why:
Conventional MRP algorithms depend on accurate forecasts of future orders.
And accurate forecasting is impossible because:
- Customer orders change *all the time*, which throws even the best forecasts out the window.
- Plant performance varies.
- Suppliers are unreliable.
To compensate you add safety stock, you use a min/max approach, you rely on intuition. But it’s still not enough.
Break the cycle with Demand-Driven Replenishment
The key to breaking this stock whiplash cycle is to adopt a Demand-Driven Replenishment (DDR) approach that involves consistently maintaining small inventory levels, pegged to correct targets.
DDR is a Theory of Constraints (TOC) approach to supply chain management. It accounts for the realities of customer demand variability, and supplier and plant performance inconsistencies for an effective, efficient response in real-time.
Ideal inventory targets are designed and managed to accomplish the twin objectives of minimizing operating costs and maximizing stock availability.
Doing so provides the stability your manufacturing floor and overall supply chain requires to deliver peak results.
Determine ideal SKU-level inventory targets
To determine the ideal maximum SKU-level inventory targets, you need visibility to:
- Item transaction frequency
- Related lead times
- Consumption level fluctuations, and more
This information is used to create properly located inventory buffers that absorb the impact of supply chain variability (customer, supplier and the plant).
These buffers are a combination of:
– in-stock inventory (similar to kanbans), and
– inventory on the way (from your suppliers or in the plant)
If all that sounds complicated and time-consuming, it doesn’t have to be.
Roadrunner’s inventory management algorithm makes it easy
Montera’s Roadrunner Rx Inventory Management Service uses a proprietary algorithm based on the principles of DDR to calculate ideal target inventory buffers.
A real time feedback loop monitors demand and supply versus actual on-hand inventory levels.
Fluctuations in demand and supply are absorbed by the buffer wall preventing stockouts and as inventory consumption occurs, it reorders what’s used.
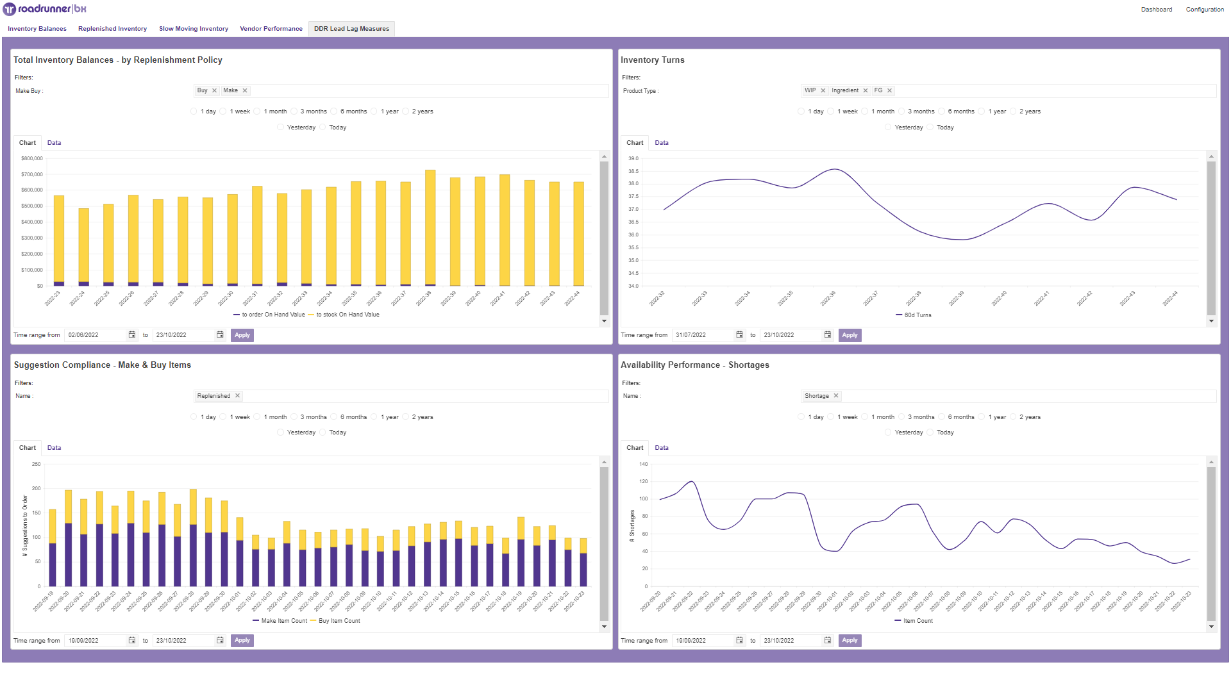
The Roadrunner inventory scorecard provides real time visibility to:
- inventory performance
- inventory levels
- returns
- shortages, and more.
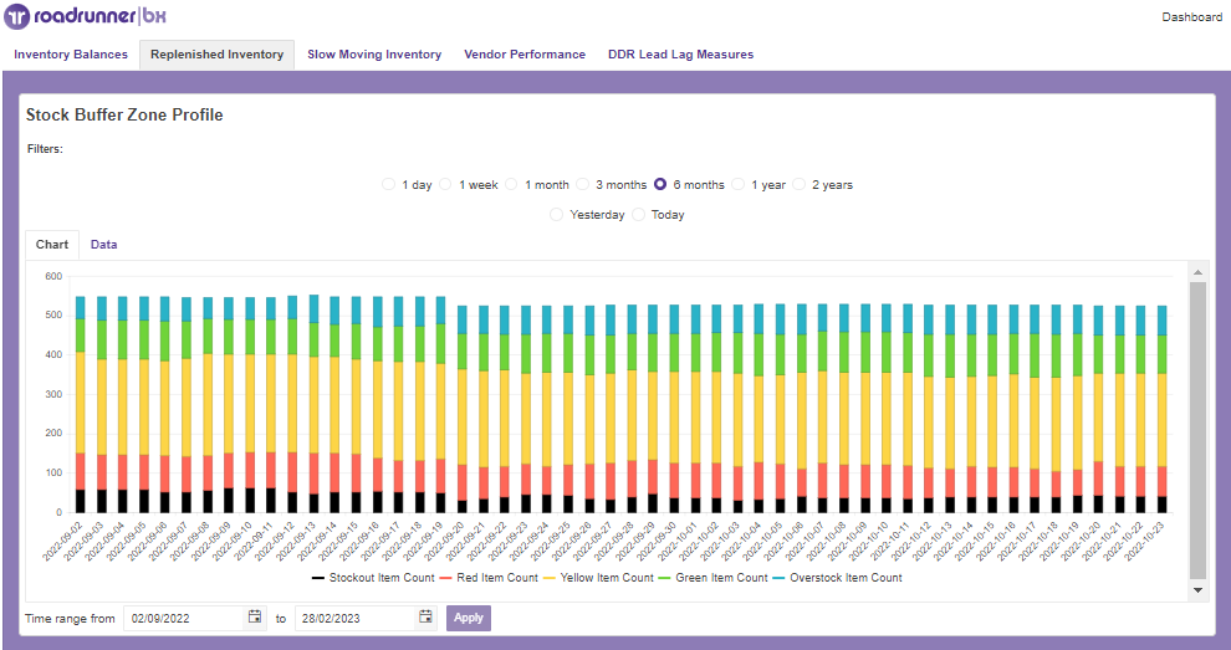
Our stock buffer zone profile provides ongoing trend evaluation of inventory position against buffer targets that affect working capital and revenue. You can monitor process improvements and their impact on business performance.
The best part is that we send regular order requirements directly to your ERP, so you know exactly what to buy and ship.
It ensures you ALWAYS have the correct stock on hand to maximize cash flow AND fulfill orders on time.
It enables our clients to routinely cut inventory by 25% to 40%.
And it works with all MRP/ERPs.
Get your FREE inventory imbalance report
Scores of manufacturers supplying complex multi-part subcomponents to global OEMs rely on Roadrunner Rx to balance inventory levels and improve supply chain efficiencies.
Learn more about our Roadrunner Rx Inventory Management Service and start with a FREE Roadrunner Rx inventory imbalance report:
 This article has been written by Jack Warchalowski, a world-leading expert in Demand Driven Replenishment (DDR) and the application of the Theory of Constraints (TOC) to the supply chain and manufacturing operations. Jack has prepared a DDR Data Feed Download that includes Results and an Implementation Snapshot of the practical application of DDR in action.
Free download.
Why traditional cost-per-unit analysis is actively undermining your business success!
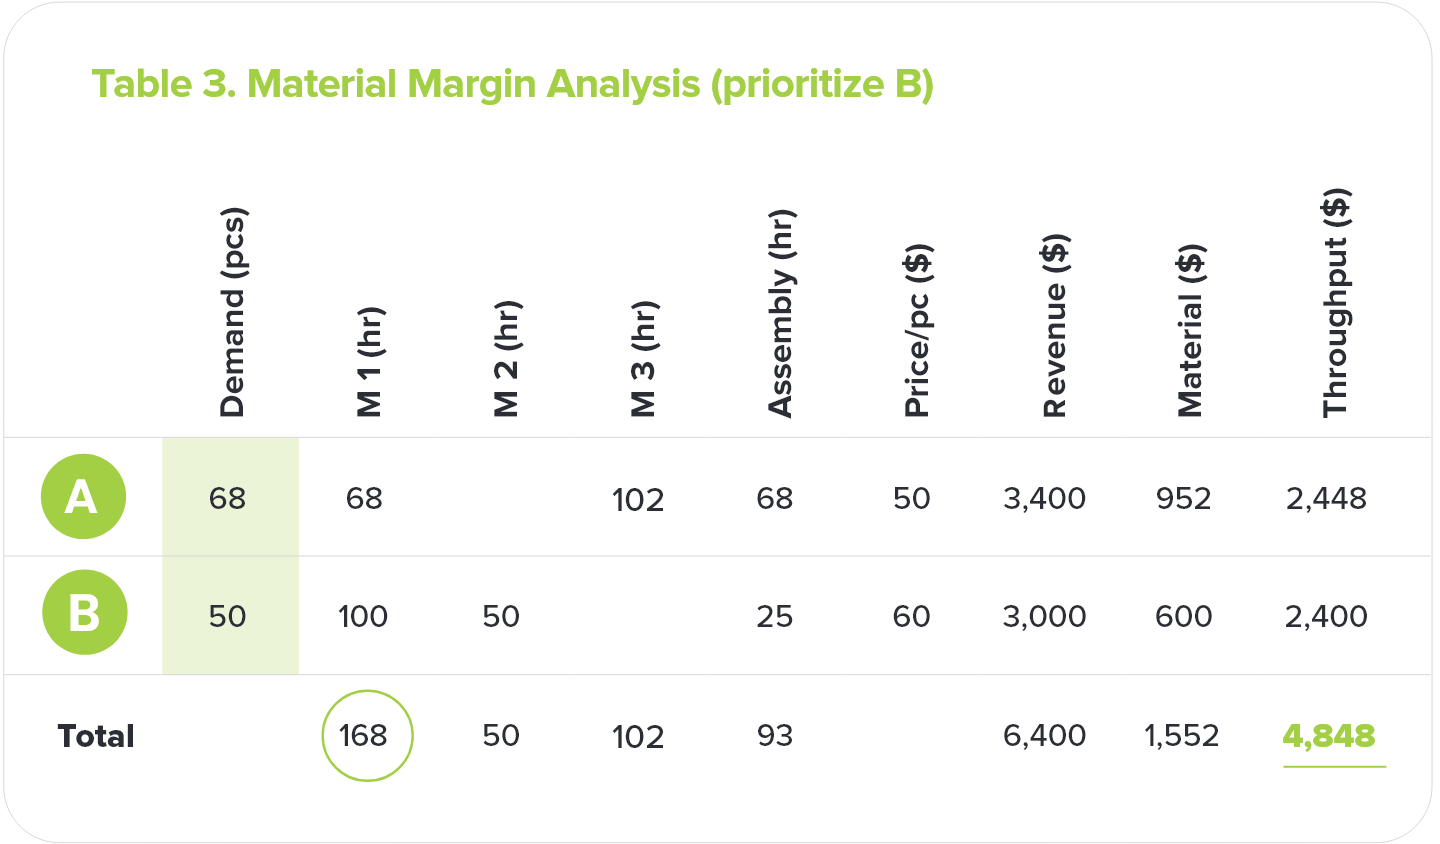
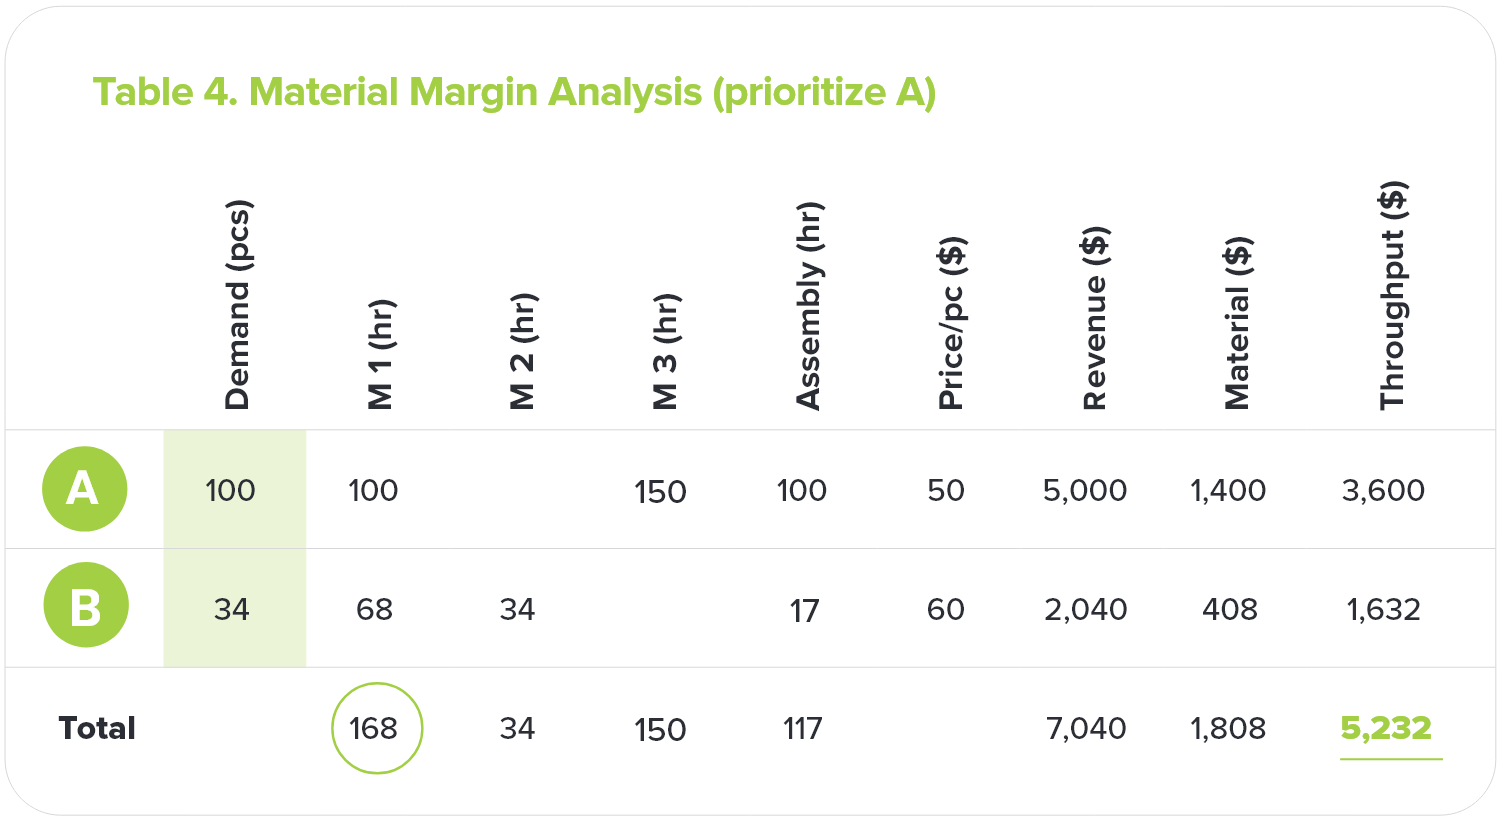
Cost-per-unit, the world’s most popular analysis process, is a devastating and flawed paradigm of traditional business decision making.
Cost-per-unit allows managers to use the concept of gross margin or contribution margin to evaluate business opportunities. It enables a simple process for decision-making. That’s why it’s very popular.
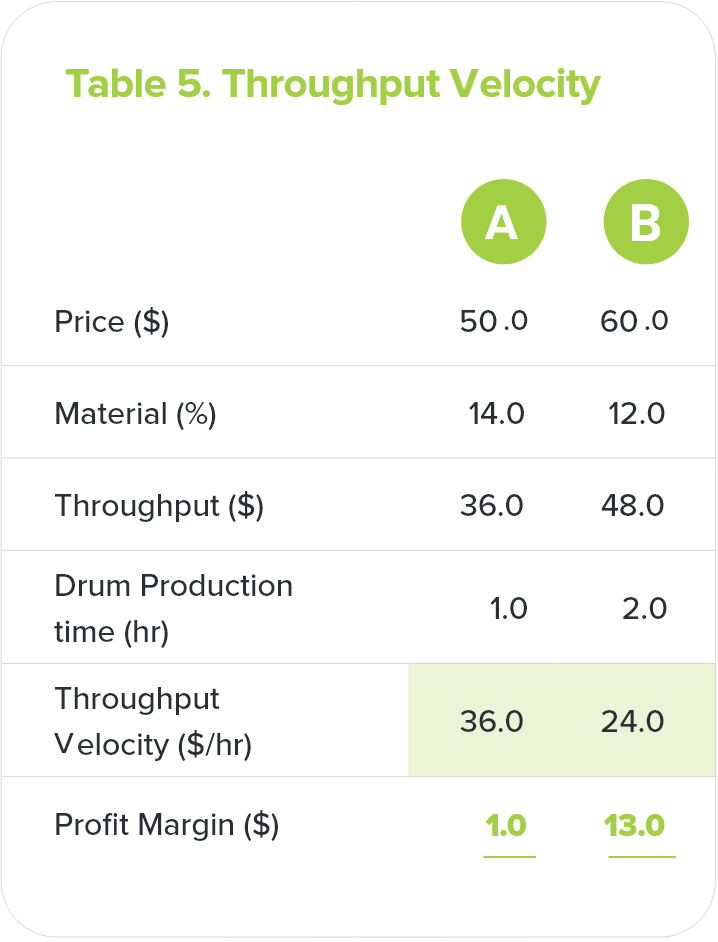
An illustration of the gross margin fallacy
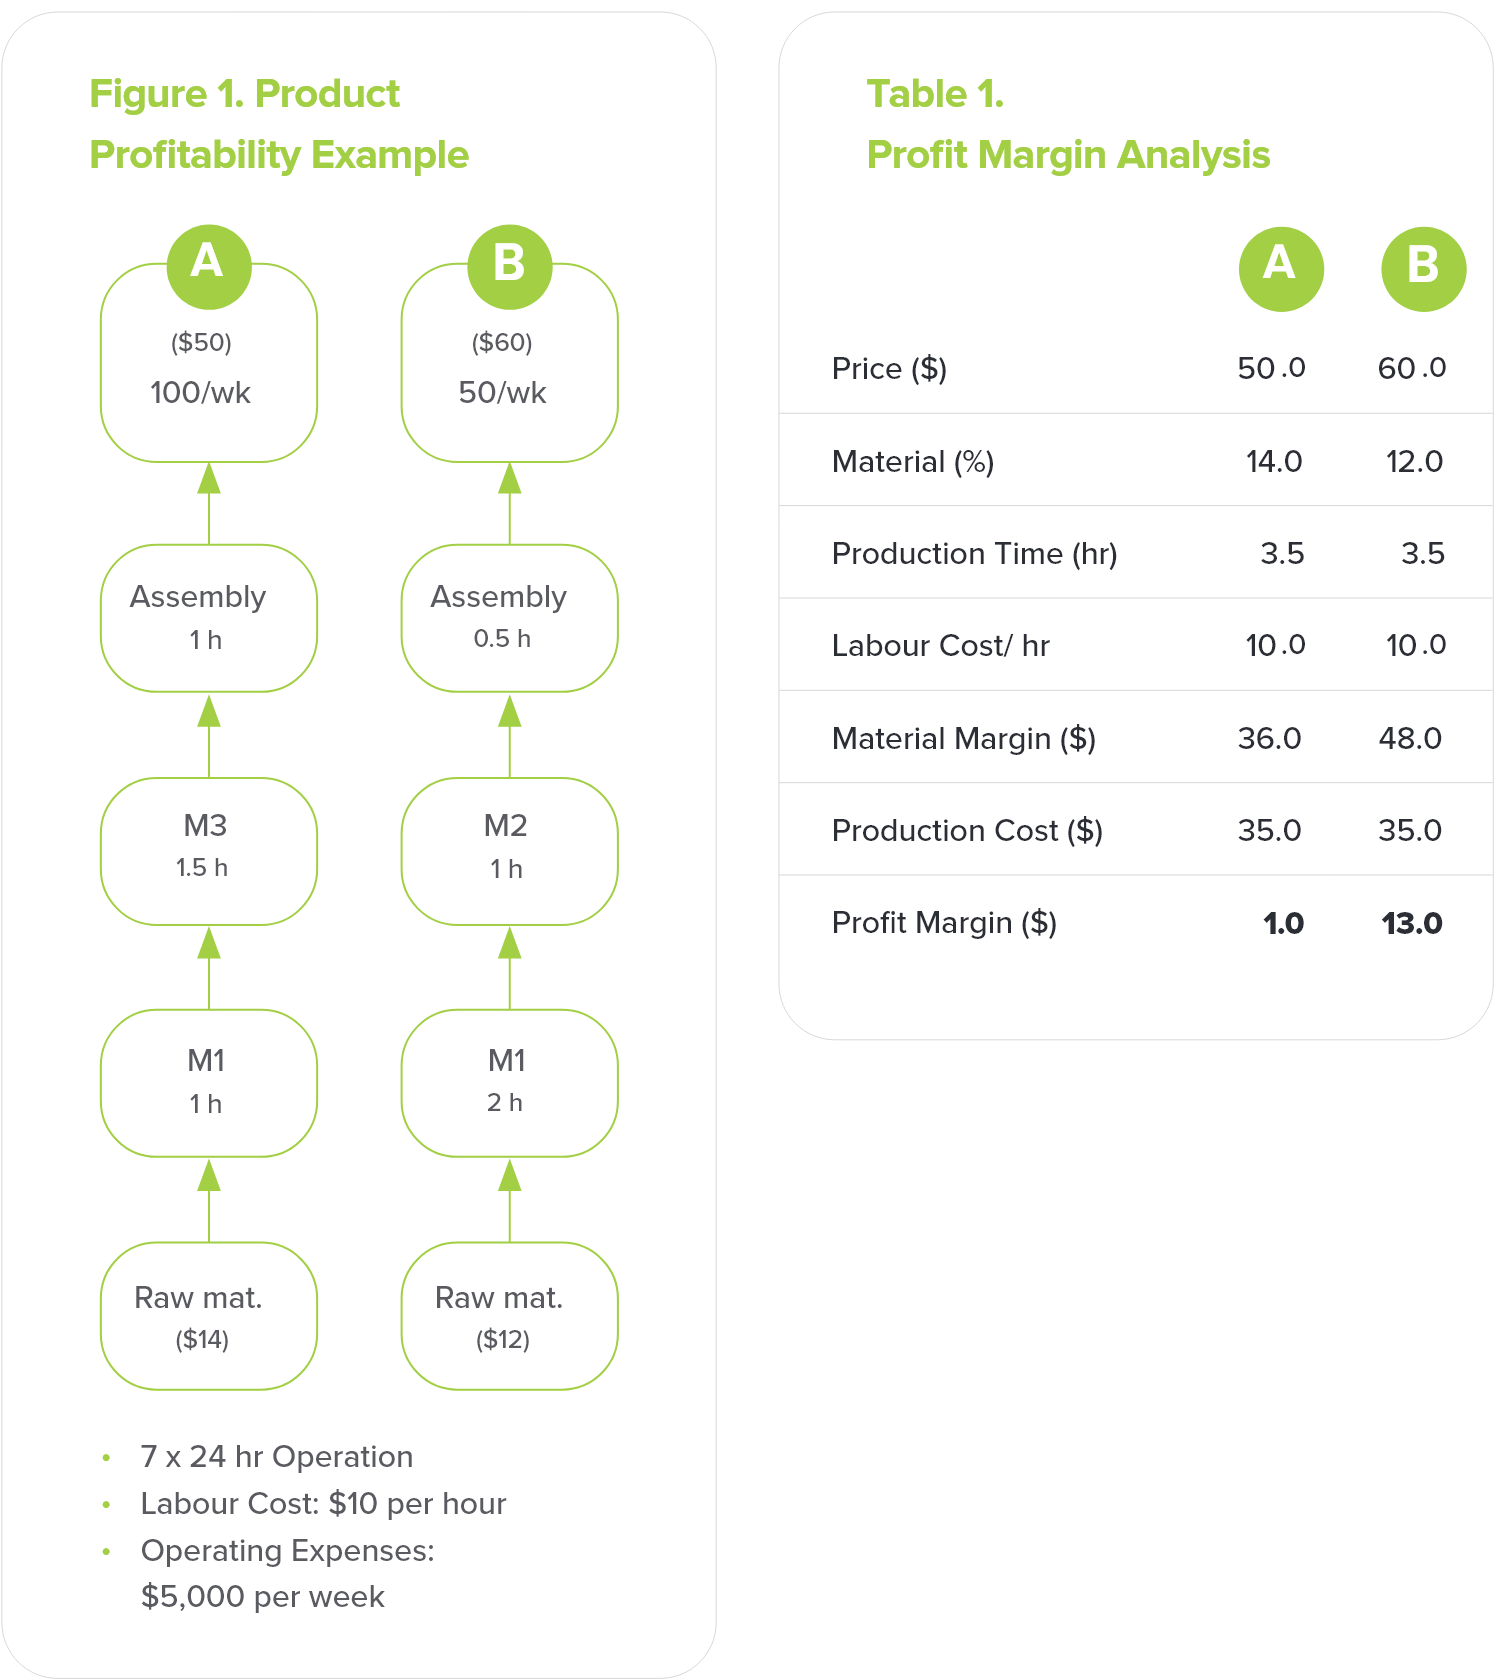
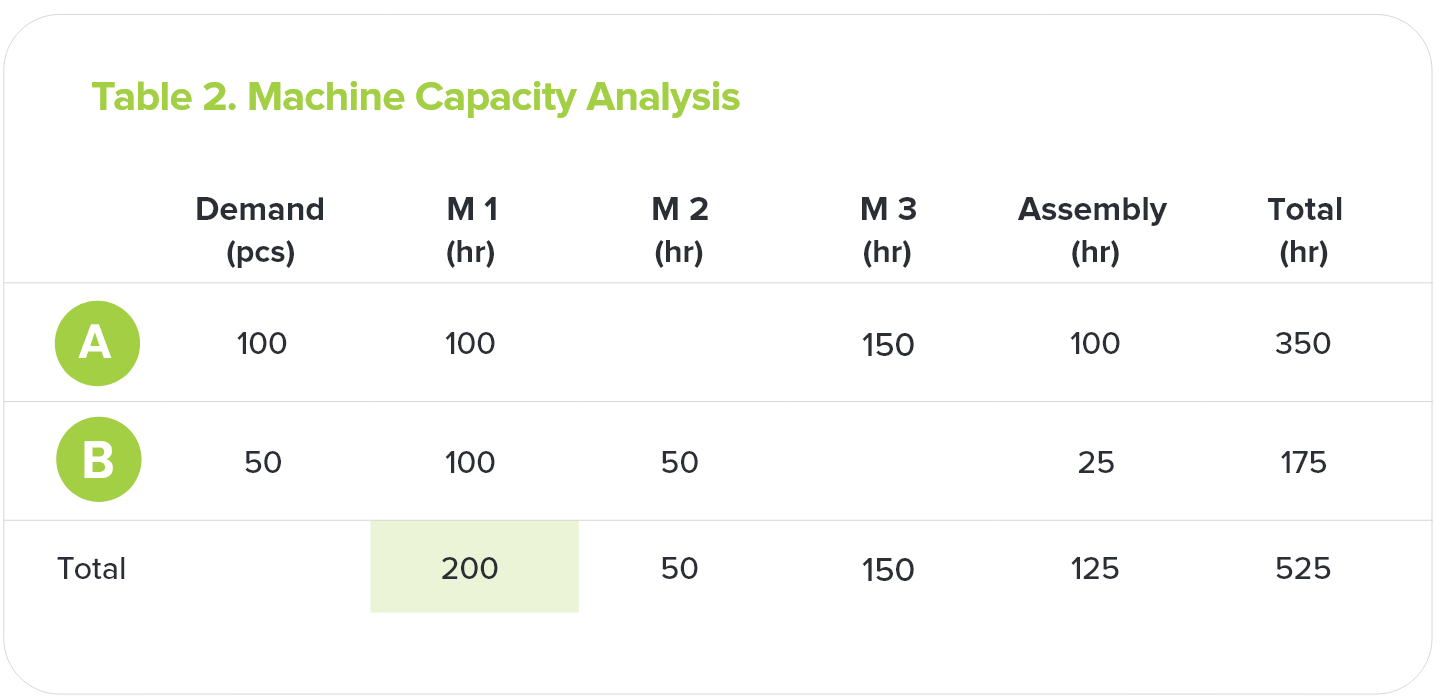
Consider a company that produces only 2 products: A and B (shown below in Figure 1). This company runs a 7 x 24hr operation, with a labour cost of $10 per hr and Operating Expenses of $5,000 per week.
 Product A is produced from Raw Materials costing $14 per unit. Product A is processed on Machine 1, Machine 3 and a Final Assembly operation at the rates specified below. It is sold for $50 each and its demand is 100 per week.
 Product B is produced from Raw Materials costing $12 per unit. Product B requires Machine 1, Machine 2 and the Final Assembly at the rates also specified below. It is sold for $60 each and its demand is 50 per week.
This article has been written by Jack Warchalowski, a world-leading expert in Demand Driven Replenishment (DDR) and the application of the Theory of Constraints (TOC) to the supply chain and manufacturing operations. Jack has prepared a DDR Data Feed Download that includes Results and an Implementation Snapshot of the practical application of DDR in action.
Free download.