Skip to content

How cost accounting wrecks profits

This article has been written by Jack Warchalowski, a world-leading expert in Demand Driven Replenishment (DDR) and the application of the Theory of Constraints (TOC) to the supply chain and manufacturing operations. Jack has prepared a DDR Data Feed Download that includes Results and an Implementation Snapshot of the practical application of DDR in action.
Free download.

Why traditional cost-per-unit analysis is actively undermining your business success!

Cost-per-unit, the world’s most popular analysis process, is a devastating and flawed paradigm of traditional business decision making.

Cost-per-unit allows managers to use the concept of gross margin or contribution margin to evaluate business opportunities. It enables a simple process for decision-making. That’s why it’s very popular.

An illustration of the gross margin fallacy

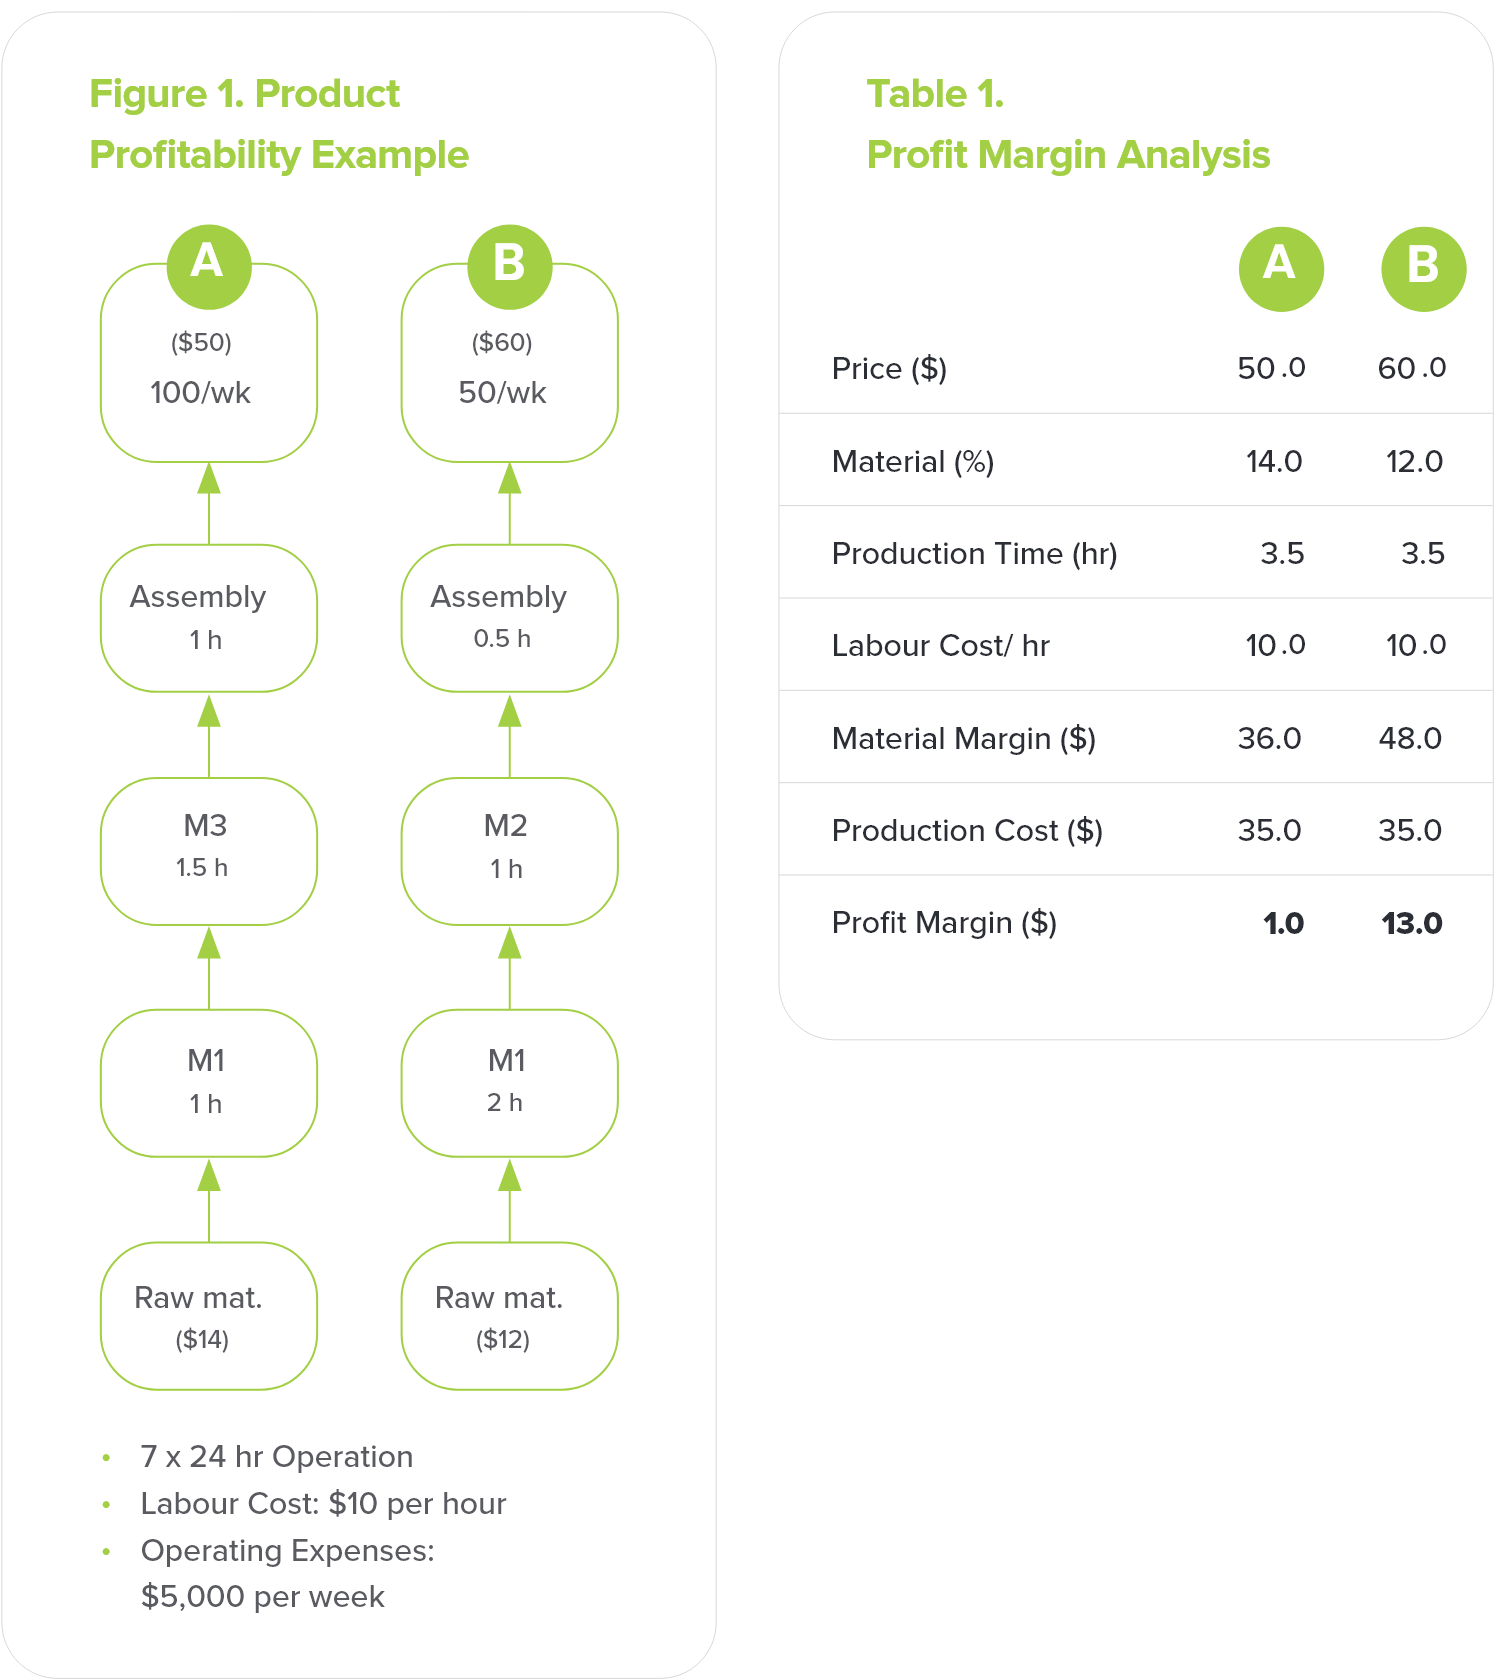
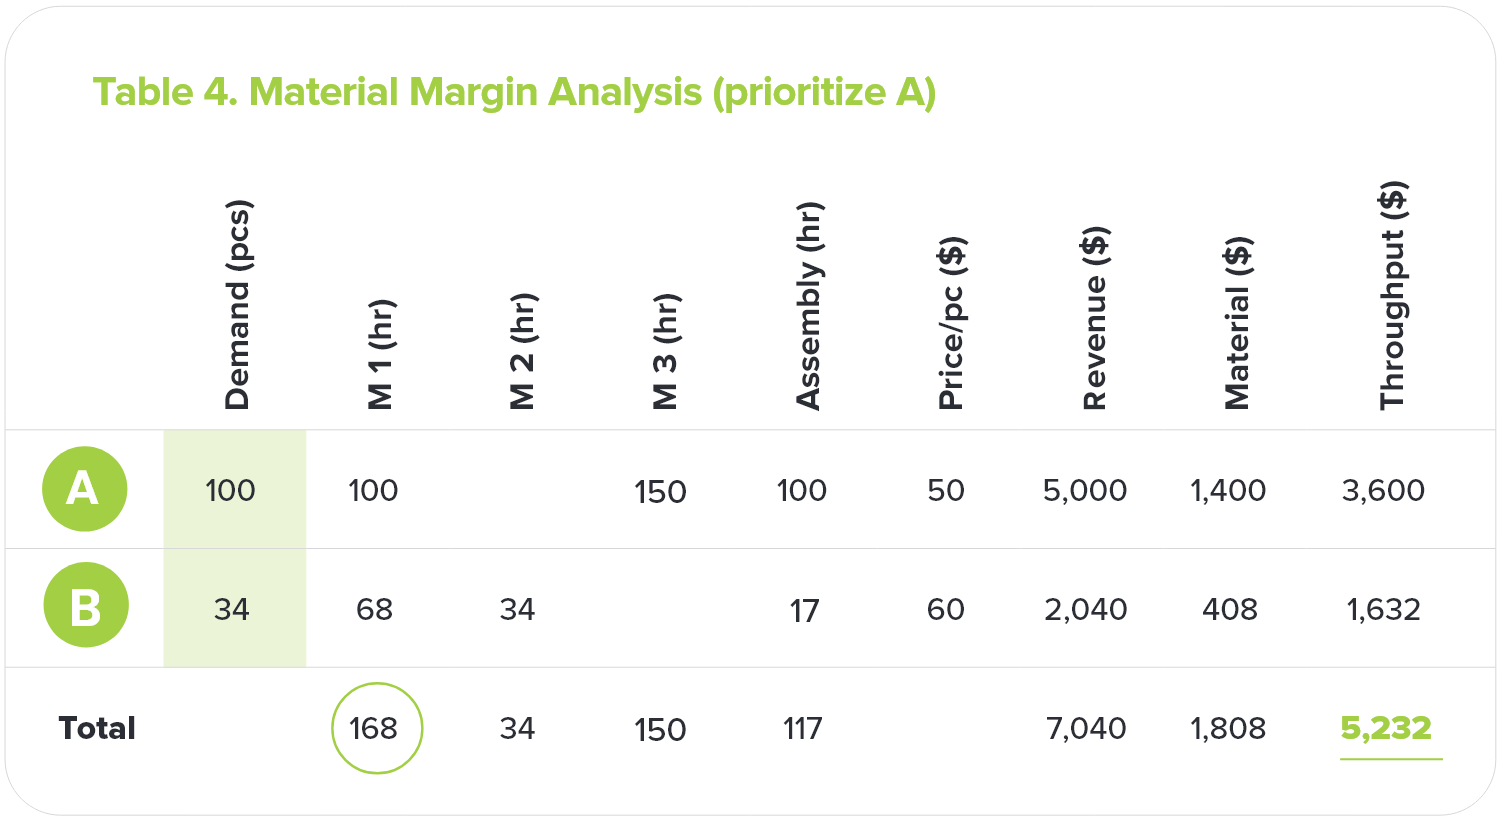
Consider a company that produces only 2 products: A and B (shown below in Figure 1). This company runs a 7 x 24hr operation, with a labour cost of $10 per hr and Operating Expenses of $5,000 per week.

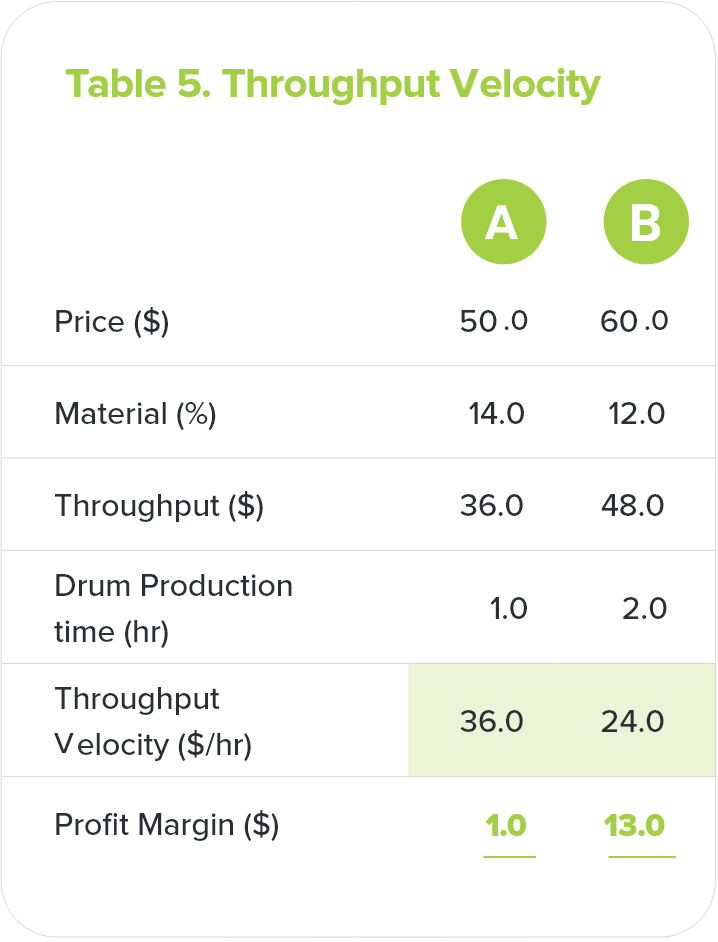
Product A is produced from Raw Materials costing $14 per unit. Product A is processed on Machine 1, Machine 3 and a Final Assembly operation at the rates specified below. It is sold for $50 each and its demand is 100 per week.

Product B is produced from Raw Materials costing $12 per unit. Product B requires Machine 1, Machine 2 and the Final Assembly at the rates also specified below. It is sold for $60 each and its demand is 50 per week.

Product A. Product B. Which is actually the more profitable product?

The Profit Margin (that is, Sales less Material Costs less Labour) Analysis shown in Table 1 demonstrates that Product B — with a profit margin of $13 per unit — is the most profitable (overhead allocations were omitted to simplify the discussion).

However, in order to judge how to maximize business profitability, we first must decide which product to prioritize. That’s because we don’t have enough machine capacity to fully satisfy market demand for both products. While there
are only 168 hours available each week in a 7x24 operation, machine M1 requires 200 hours to produce enough of Product A and Product B (see Table 2) to fully meet demand.

Common business logic suggests that we should first produce the product with the highest Profit Margin (Product B) and then use the remaining capacity for the other product (Product A).

But is that the optimal choice?

The Cost Accounting approach: prioritizing Product B

In order to analyze the overall profit impact, we need to calculate the net profit associated with producing all B and some A. Since the demand for B is 50 units per week, we need 100 hours (50 x 2 hours) of production capacity for B, leaving only 68 hours open for Product A.

This scenario generates $4,848 of Material Margin ($ Throughput) per week (Table 3) for the company.

Since Operating Expenses for the company are $5,000 per week the resulting Net Profit is negative $152. Therefore, maximizing production of the highest Profit Margin Product (B) and satisfying its full demand of 50 / week leads to a weekly profit loss of $152.

The counterintuitive approach: prioritizing Product A

What if we prioritized Product A instead?

Under this scenario we can satisfy the entire demand for product A (100 pcs) and dedicate the rest of M1 capacity to product B. Based on 68 hours available we can only produce 34 pieces of product B (each piece needs 2 hours on M1). This scenario generates $5,232 of Material Margin every week. (Table 4 to the right).

Since Operating Expenses for the company are $5,000 per week the resulting Net Profit is a positive $232. This means that maximizing production of the lowest Profit Margin Product (A) and satisfying its full demand of 100 units per week will lead to a weekly profit gain of $232.

How is this possible?

A lower profit margin can lead to higher net profit

Here we’ve challenged the widely held belief that the contribution margin of a product is the best proxy for company’s profitability.

In most situations it is NOT.

Contribution and/or Product Profit Margin is an arbitrary and misleading judge of product profitability.

This conclusion has large implications on several sales and marketing decisions:

  • which markets to focus on
  • what business to accept
  • how to develop new products that maximize profit
  • which customers to prioritize for long term business relationships

Throughput Velocity reveals where the profit really lies

Throughput Economics (TE) uses an alternative approach to discern relative product and market profitability – it is called Throughput Velocity (TV)

Using the same example, we know that Machine 1 sets the pace for the entire operation and should be considered the critical resource (in Theory of Constraints parlance, it would be called the drum — it has the least capacity and sets the beat for everything else in the plant).

True Product Profitability is determined by calculating the rate of dollar contribution of each product on this critical resource. This is measured by taking the difference between a product’s sales price and its totally variable cost (mainly raw materials) and dividing it by the production rate on the critical resource (Table 5 to the right).

This measurement of product profitability is perfectly aligned with net organizational profit — higher TV for Product A equals higher net profit.

Understanding Throughput Velocity (TV) has significant implications on decisions regarding:

  • What market segments are most profitable
  • Which products make the most money
  • Whether some products are actually unprofitable
  • Investment & make vs. buy decisions
  • The price at which companies should accept orders
  • Aligning operating costs & plant capacity with market demand
  • Where to focus R&D efforts

Manufacturing businesses need to understand their products’ Throughput Velocity if they are to maximize business profitability.

This article has been written by Jack Warchalowski, a world-leading expert in Demand Driven Replenishment (DDR) and the application of the Theory of Constraints (TOC) to the supply chain and manufacturing operations. Jack has prepared a DDR Data Feed Download that includes Results and an Implementation Snapshot of the practical application of DDR in action.
Free download.

About CMS Montera

CMS Montera are specialists in software and consulting that help clients solve problems in Operations and the Supply Chain. World-leading experts in Theory of Constraints and Lean Thinking.

Share